Simulated LiF screen study
The first version of the nFacet 3D system had three LiF:ZnS screens on each PVT cube. However, when developing the mark 2 version of the system, a Monte Carlo study was done to investigate the effect of reducing the amount of LiF:ZnS in the system. One motivation for this is cost; if the amount of LiF:ZnS used per cube can be reduced it can significantly reduce the cost of production for a system.
An additional motivation for this study is an asymmetric response caused by the asymmetric placement of the LiF:ZnS screens. For example, consider the X direction where the LiF:ZnS screen is on the negative X face. Neutrons incident from positive X can thermalise in the cube and then capture on the screen on the negative X side of that cube. However, neutrons incident from negative X are more likely to pass through the LiF:ZnS screen and then scatter into the subsequent cube, producing an excess of counts in the subsequent cube and a reduced count in the initial cube. This is illustrated in the figure below. As a result of this asymmetric effect, we find the detector response depends on the direction of incidence of radiation. If possible, we want to symmetrise the response so measurements can be made at any angle of incidence without additional correction.
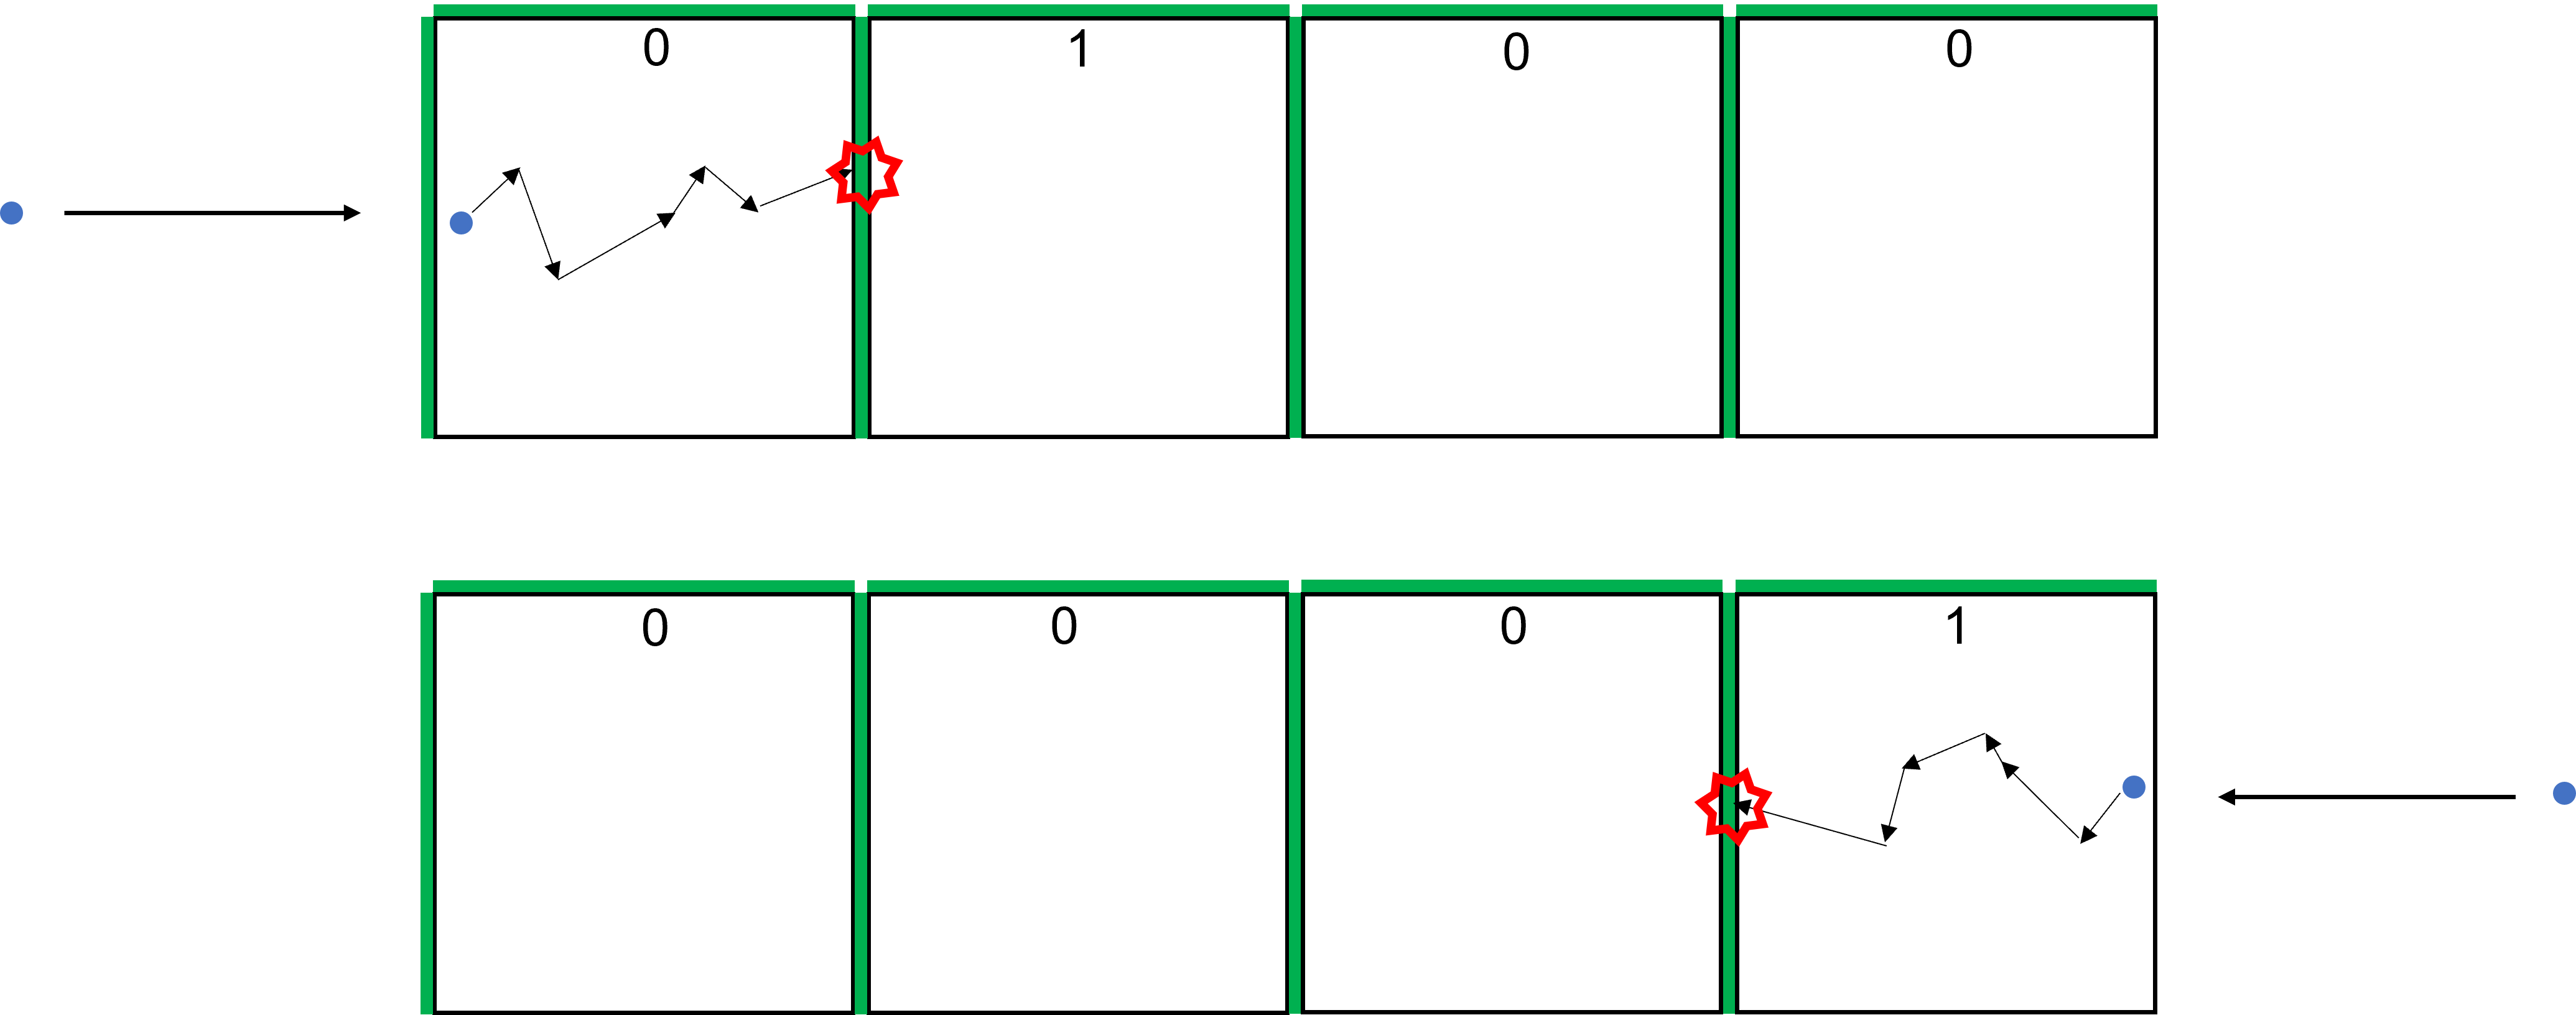
Figure 1: illustration of the asymmetric effect introduced by the screen placement. The green bars indicate the placement of the screens, and each cube is labelled with the measured count in that cube. Top: a neutron incident from the left passes through the outward facing screen on the first cube, thermalises in the first cube, and then captures on the outward facing screen in the second cube, producing an excess of counts in the second cube. Bottom: a neutron incident from the right thermalises in the first cube and captures in that same cube. As a result, we can see that we will obtain a different distribution of counts depending on the incident direction of neutrons and on the orientation of the detector.
The determining factor as to whether this reduction in LiF:ZnS is viable is the effect on efficiency of measurement. The existing detector efficiency is at around 70% at thermal energies, averages 35% in the region up to 1 MeV, then declines from 1 MeV to 10 MeV to approximately 10% at high energies. This can be seen in REAL VS SIM SECTION. In general, a reduction in efficiency from these situations is not intolerable, so long as it is not too extreme. This study aims to investigate to what degree the efficiency decreases when the amount of LiF:ZnS is reduced.
The standard screen placement scheme is 5cm by 5cm screens on the negative X, positive Y, and negative Z faces of each cube. In this study, two other screen placement schemes were simulated: one 5cm by 5cm screen on the negative Z face and one 2.5cm by 2.5cm screen on the negative Z face respectively. These three schemes are shown in the figure below, labelled as (a), (b) and (c) respectively.
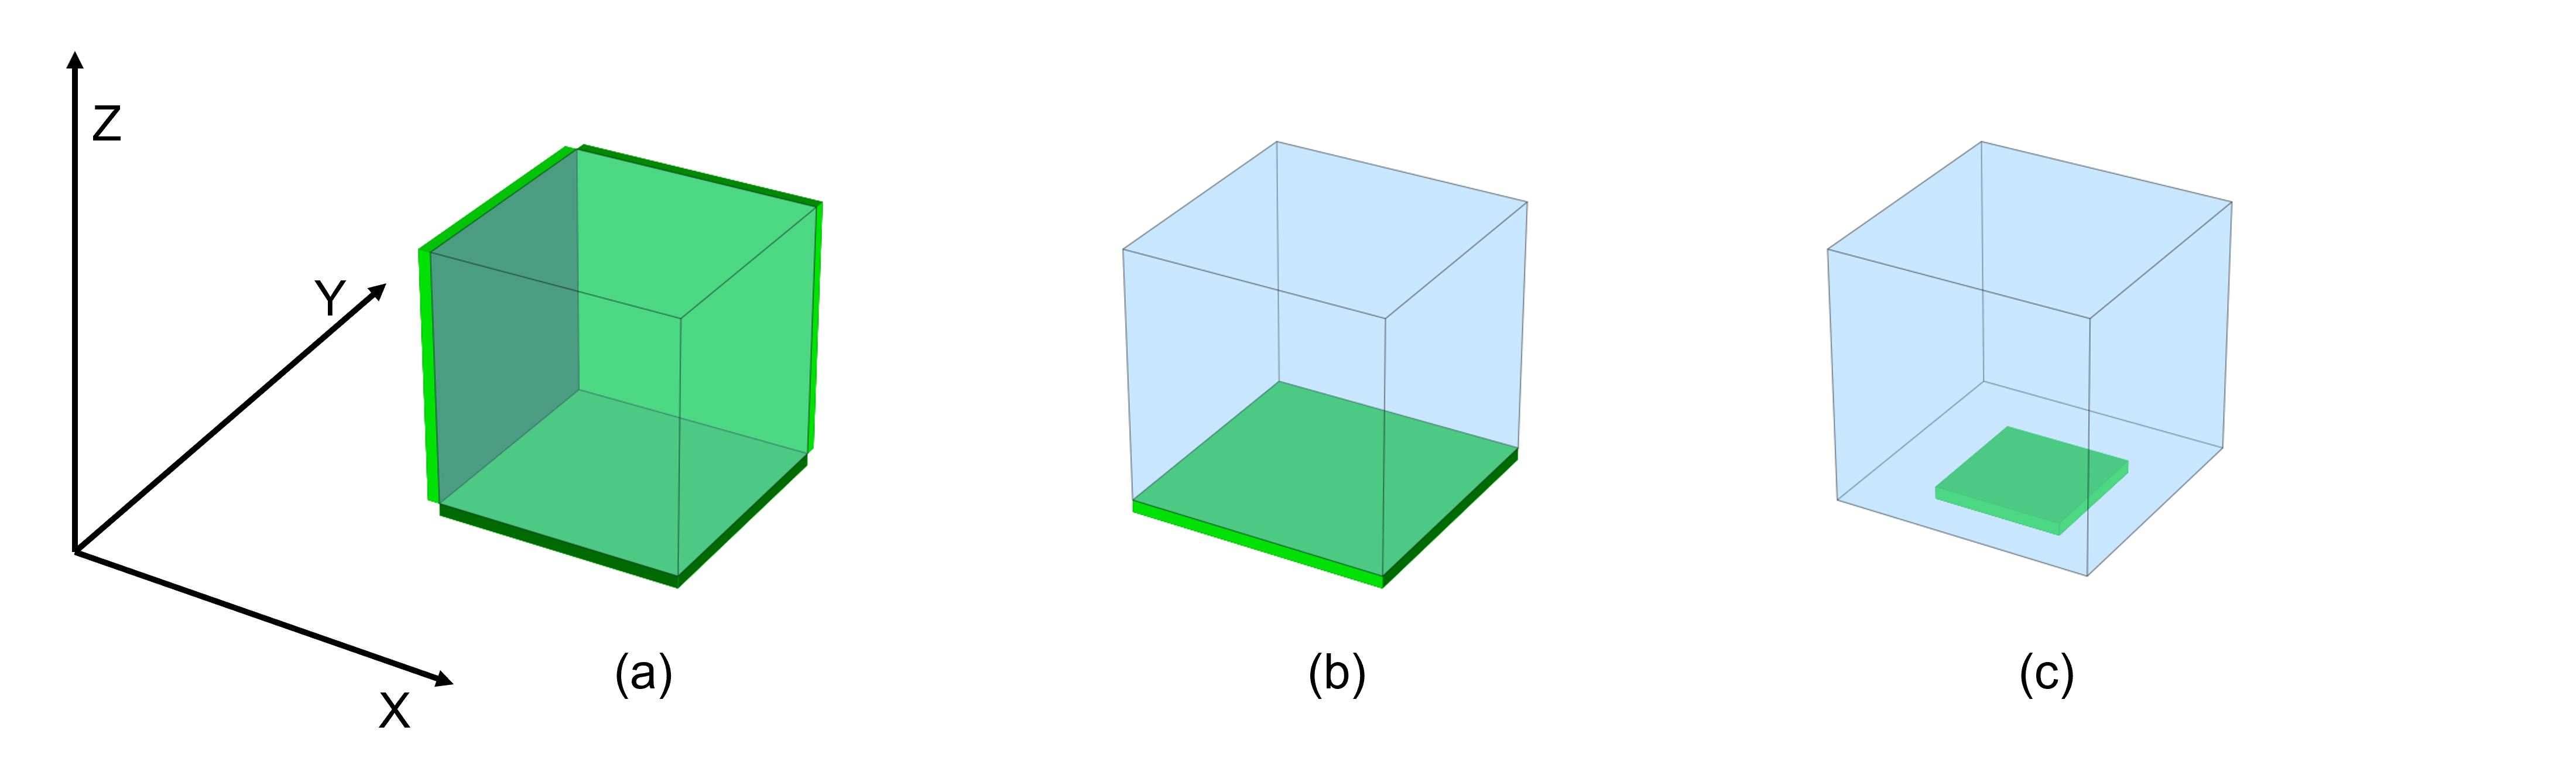
Figure 2: schematic of the screen placement schemes studied in this analysis. (a): 5cm by 5cm screens on negative X, positive Y, and negative Z, resulting in asymmetric effect in all three directions. (b): 5cm by 5cm screen on negative Z, reducing the asymmetry to just the Z direction. Reduces the LiF:ZnS thermal neutron capture volume by a factor of 3. (c): 2.5cm by 2.5 cm screen on negative Z, reducing the LiF:ZnS volume by an additional factor of 4 for a total reduction factor of 12 (\(\sim\) 6% of the original volume).
Effective dose is measured by first measuring the fluence of a radiation field, and then converting it to an effective dose based on the incident direction of the field via a set of dose conversion coefficients published by the International Comission for Radiation Protection (IRCP) [1]. These coefficients are calculated using an adult male and female reference phantom based off of computerised tomopgraphy data of real people. The 6 geometries considered by the ICRP are as follows: antero-posterior (AP), postero-anterior (PA), right lateral (RLAT), left lateral (LLAT), rotational (ROT), and isotropic (ISO). For each geometry the dose to each organ of the voxelised phantoms is computed and summed for a known fluence, and the dose conversion coefficient for that geometry is calculated as the total dose divided by the known fluence. The AP, PA, RLAT and LLAT geometries consider a radiation field incident from the front, back, left side and right side respectively, whilst the ROT geometry considers a source that rotates around the phantom at a constant rate and the ISO geometry considers an isotropic exposure of the phantom to the radiation field [1].
All of these geometries apart from the ISO geometry consider radiation incident in a direction orthogonal to the long axis of the phantom, such that the direction of incidence is in the x-y plane. This motivates placing the single screen on either the top or bottom of the cube, as the effective dose coefficients are predominantly dependent on directions in the x-y plane and thus asymmetry perpendicular to the x-y plane has a lesser effect on the dose measurement. Additionally, the majority of real radiation fields will predominantly be in the x-y plane. We decide to place the single screen on the bottom of the cube as the majority of real radiation with a vertical component will be cosmic background from above.
Goals of the study
This study aimed to assess to what degree the amount of LiF:ZnS used per cube could be reduced, and what effect this would have both on the efficiency of the system and on the asymmetry observed in the three screens scenario. For each screen placement scheme, the detector was simulated at a distance of 1.5 m from the source in the NPL low-scatter facility geometry as described in SECTION ABOUT SIMULATION-REAL COMPARISON, with the positive y face of the detector facing the source. The source was constrained to emit neutrons in a cone towards the source, such that both \(\theta\) and \(\phi\) were in the range of -\(\frac{\pi}{6}\) to \(\frac{\pi}{6}\), relative to the y-axis. This range of angles was chosen to improve the running time of simulations as neutrons emitted in the opposite direction to the detector would very rarely reach the detector and thus were wasted computation time.
4 different sources were simulated: monoenergetics at 100 keV, 500 keV and 1.2 MeV, and a \(^{252}\)Cf source. These sources were chosen to be representative of typical energies of interest; 100 keV to represent a low energy source, 500 keV as an intermediate energy, 1.2 MeV as a fast neutron source and equivalent to one of the sources measured in the 2021 NPL measurement exercise, and \(^{252}\)Cf as a more realistic neutron source. For each of these sources, the efficiency for each screen placement scheme was calculated as the ratio of the number of neutrons that capture on the LiF:ZnS screens to the total number of neutrons that enter the detector. The calculated efficiencies for the scheme with three 5 cm by 5cm screens, one 5cm by 5cm screen, and one 2.5cm by 2.5cm screen are denoted as \(\varepsilon_3\), \(\varepsilon_1\) and \(\varepsilon_1^s\) respectively. These efficiences for each source are given in the table below, as well as the ratio of \(\varepsilon_1\) and \(\varepsilon_1^s\) to \(\varepsilon_3\).
Source |
\(\varepsilon_3\) |
\(\varepsilon_1\) |
\(\varepsilon_1^s\) |
\(\varepsilon_3 : \varepsilon_1 : \varepsilon_1^s\) |
|---|---|---|---|---|
100 keV |
39.80 \(\pm\) 0.21 % |
21.49 \(\pm\) 0.15 % |
8.74 \(\pm\) 0.10 % |
1 : 0.540 : 0.220 |
500 keV |
36.43 \(\pm\) 0.19 % |
20.84 \(\pm\) 0.28 % |
8.66 \(\pm\) 0.18 % |
1 : 0.572 : 0.238 |
1.2 MeV |
33.12 \(\pm\) 0.18 % |
19.39 \(\pm\) 0.13 % |
8.38 \(\pm\) 0.09 % |
1 : 0.585 : 0.253 |
\(^{252}\)Cf |
29.80 \(\pm\) 0.23 % |
17.47 \(\pm\) 0.18 % |
7.20 \(\pm\) 0.12 % |
1 : 0.586 : 0.242 |
The efficiency of the one screen scheme is on average 57.1% of that of the one screen scheme, whilst the one 2.5 cm by 2.5 cm screen scheme is on average 23.8% of that of the three screen scheme. The error on these efficiencies is from the Poisson error on the total count of neutrons captured on LiF:ZnS screens. To contextualise the relative efficiencies shown in the final column, we can consider the effect on measurement time; the one screen scheme will take approximately twice as long to measure the same count as the three screen, whereas the 2.5 cm by 2.5 cm screen scheme will take 4 to 5 times as long, which is likely to be prohibitively long in most measurement environments.
It is also of interest to compare the distribution of counts across planes, in order to assess the effect of the different screen placement schemes on the asymmetric response previously identified. The figures below showcase this for the four sources simulated in this study. In these figures, the 2.5 cm by 2.5 cm screen scheme is referred to as 1 half screen.
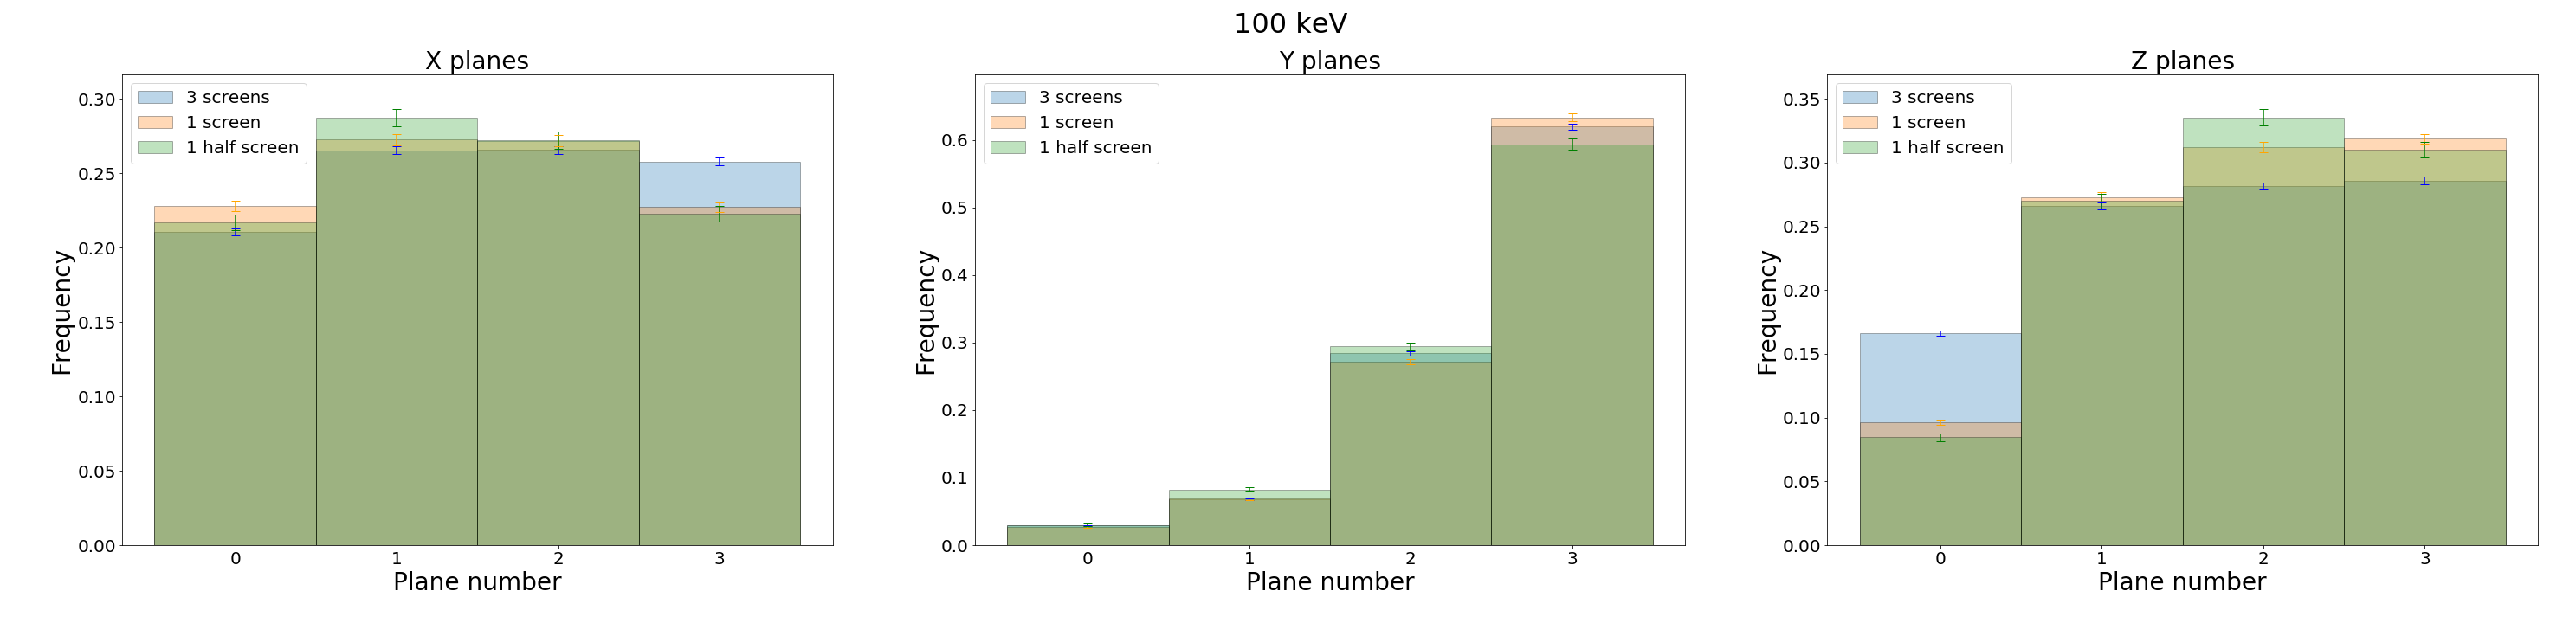 Figure 3: Comparison between plane counts for 100 keV for the three screen placement schemes.
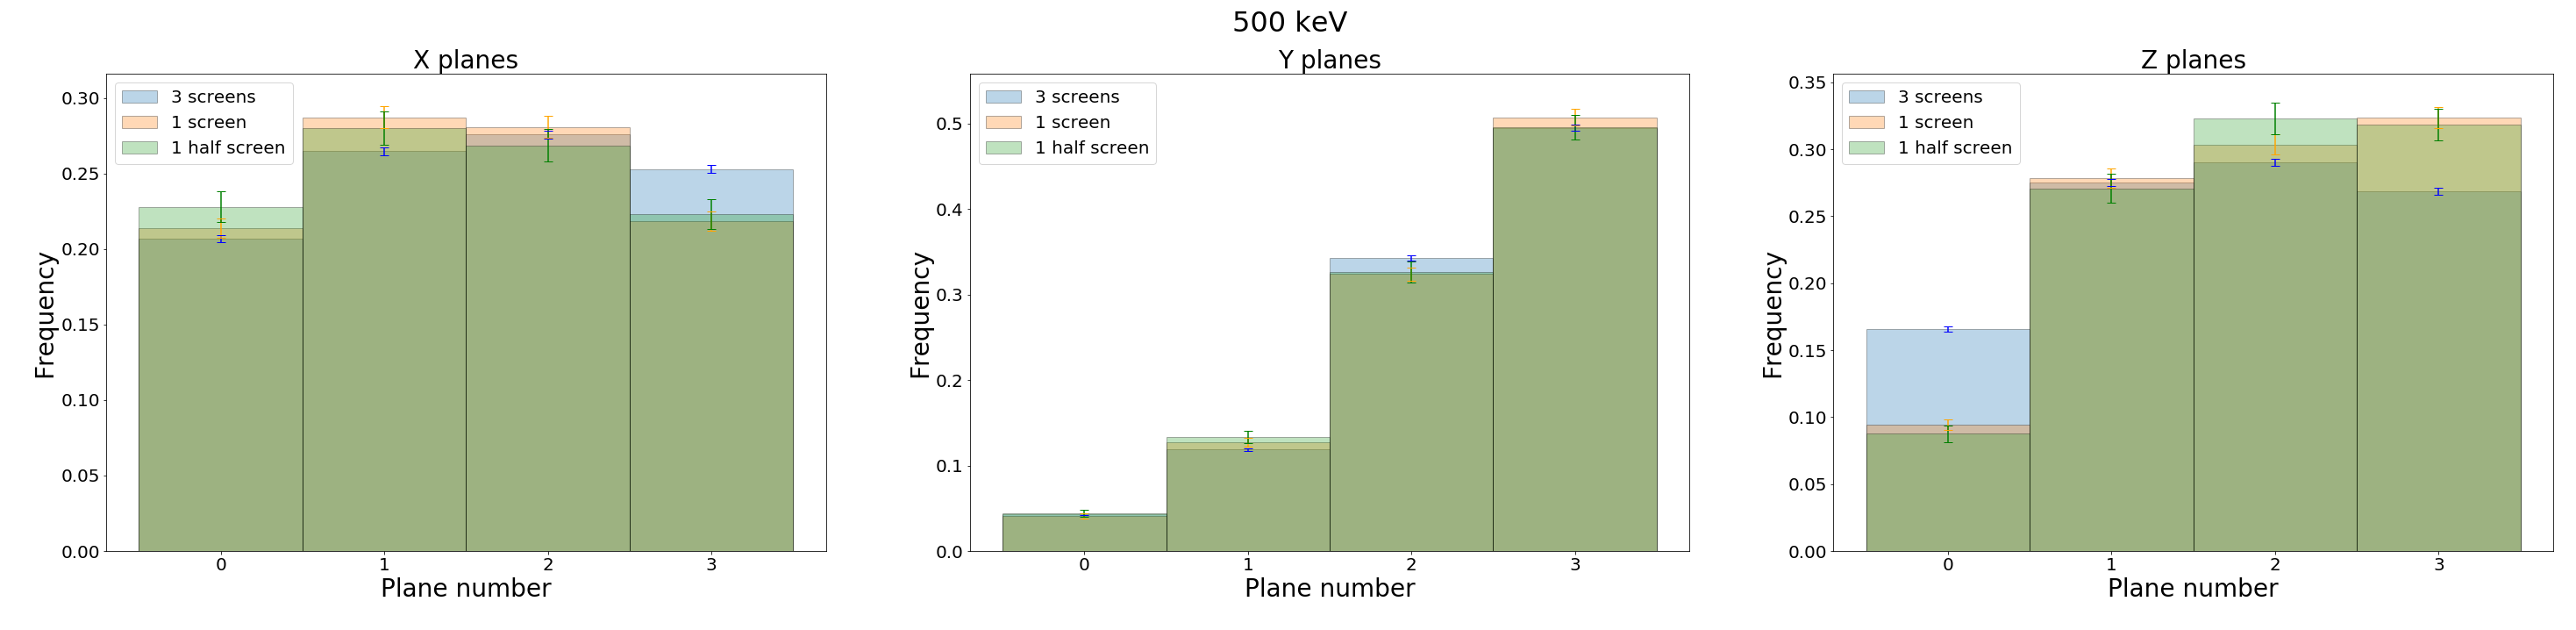 Figure 4: Comparison between plane counts for 500 keV for the three screen placement schemes.
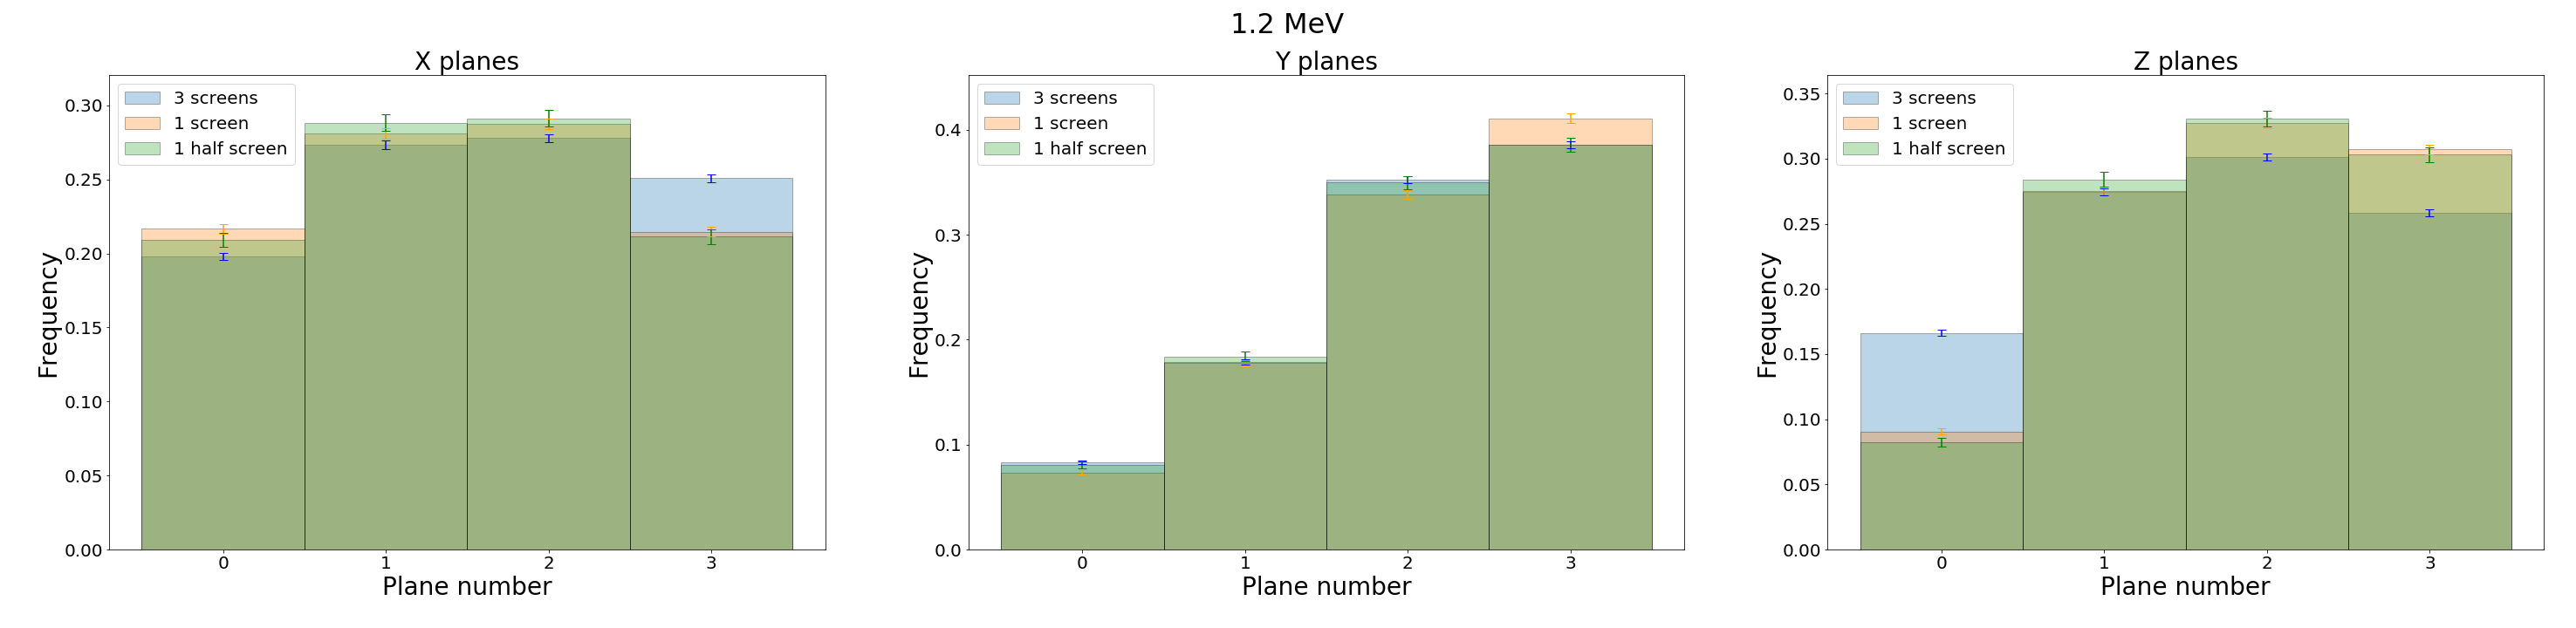 Figure 5: Comparison between plane counts for 1.2 MeV for the three screen placement schemes.
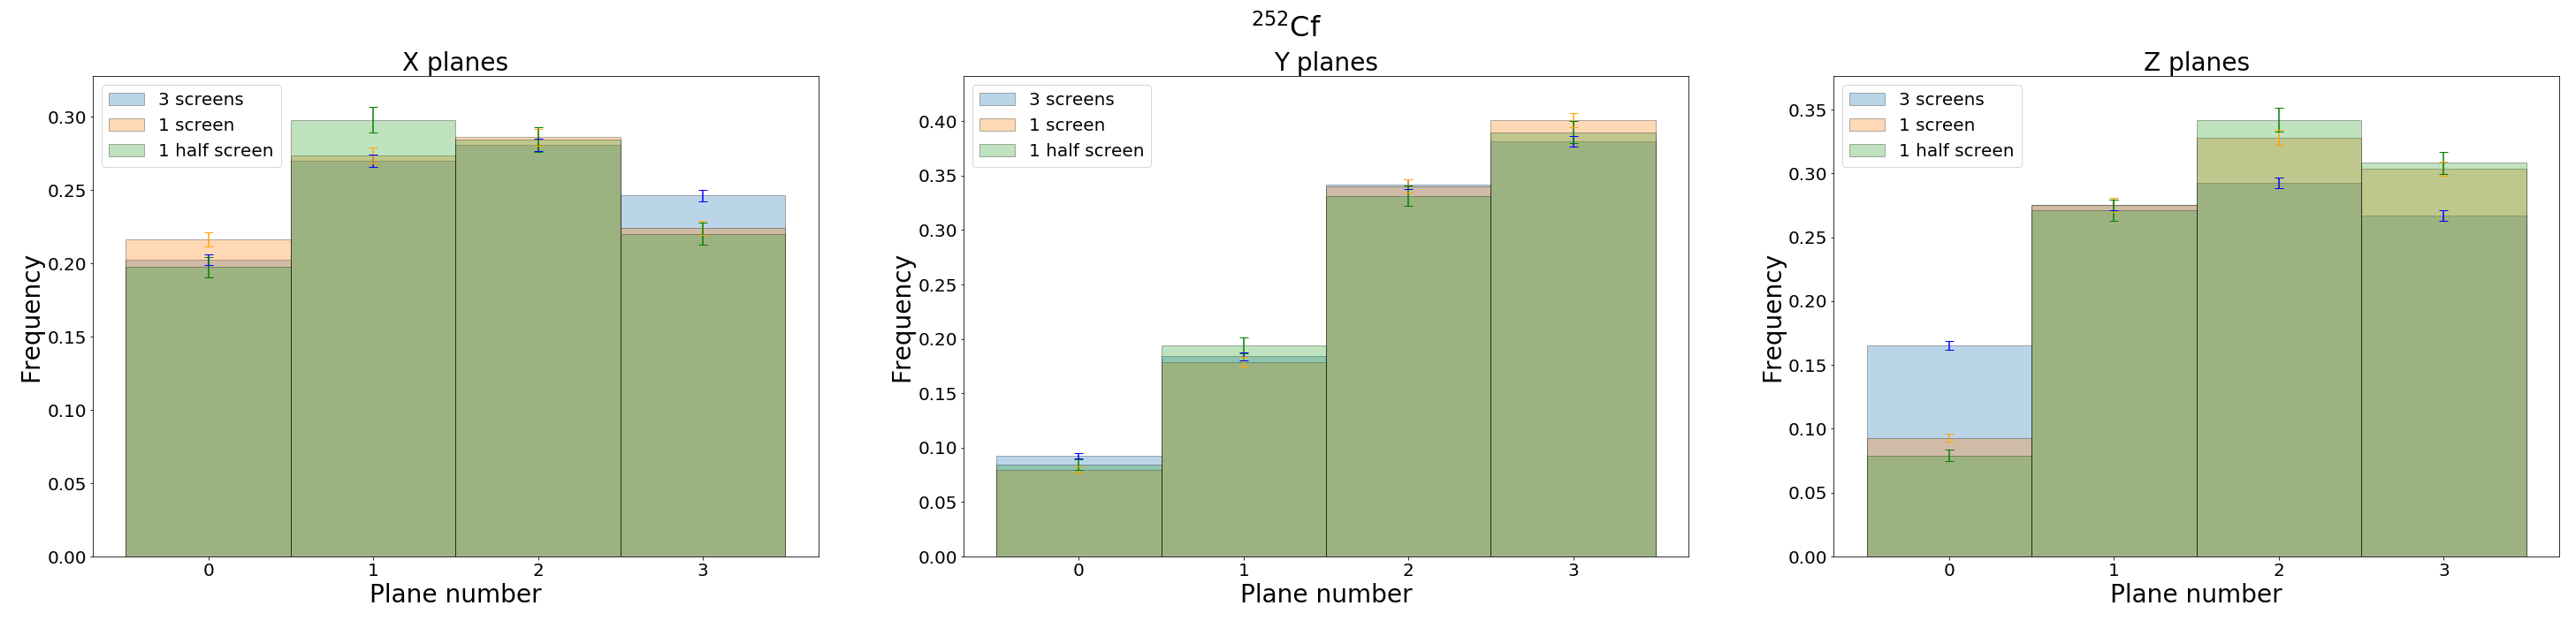 Figure 6: Comparison between plane counts for \(^{252}\)Cf for the three screen placement schemes.
There are several key points identified from these plots:
In both the X and Y directions, the asymmetric effect is reduced for the 1 screen and the 1 half screen cases. For the X direction, this is an increase in the X = 0 plane and a decrease in the X = 3 plane relative to the 3 screen case, whereas for the Y direction this is an increase in Y = 3 and a decrease in X = 0, as in the 3 screen case the screens are on the negative X and the positive Y faces respectively.
In the Z direction, we note an increase in asymmetry when we move from the 3 screen case to the 1 screen and half screen cases. This is because in these cases all captures are on Z face screens.
In some cases it does appear that there is additional asymmetry in the core for the half screen case, but this is generally within error bars and so we cannot make a conclusion as to whether there is an extra effect from the reduced screen size, beyond the reduction in efficiency.
From this analysis we can see that the 1 screen scheme has the best improvement regarding the asymmetric bias in the X and Y directions without introducing additional biases, and only results in a 50% reduction in efficiency whilst reducing the necessary volume of LiF:ZnS by a factor of 3. In contrast, the half screen scheme has a 20-25% reduction in efficiency from the three screen case despite reducing the asymmetric effect in the X and Y directions, which is in a realistic measurement scenario is likely to result in prohibitively long measurement times. A further study may be necessary to better quantify the additional asymmetry in the Z direction that arises in the one 5 cm by 5 cm screen and one 2.5 cm by 2.5 cm schemes for correction of data from a new system.
[1] ICRP. (1996). Conversion coefficients for use in radiological protection against external radiation. ICRP Publication 74. Annals of the ICRP, 26(3–4), 1–205.